We often use the term "Report" in the workplace to refer to data that has been organized or analyzed, such as daily tasks list, monthly sales reports, annual performance reports, accounts receivable summaries, pie charts, and pivot tables. However, each type of report has its own format. Because reports vary, producing them in Ragic may require different methods, not just the Reports feature. The following will explain which features to use in different scenarios.
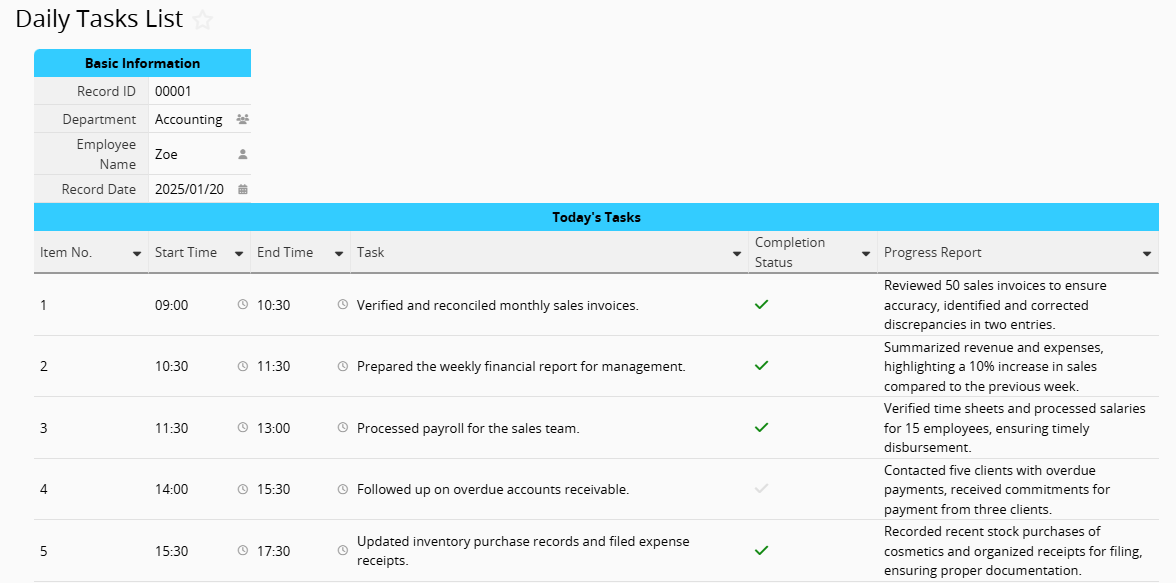
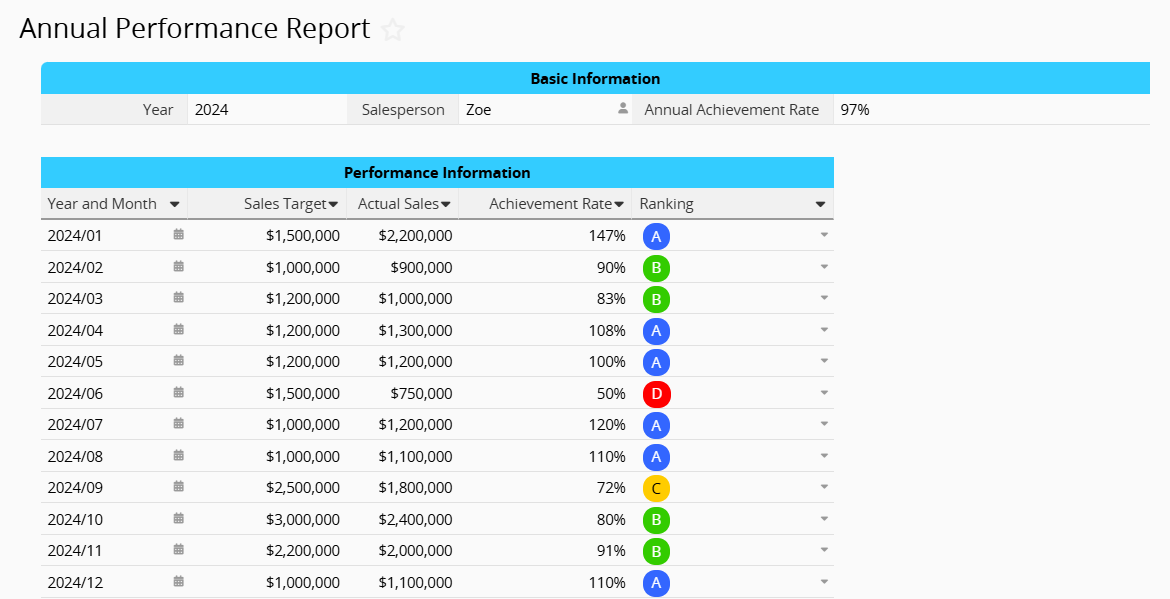
For reports like daily tasks list or annual performance reports, you can add Subtables directly to your sheet.
Example: Daily Tasks List
Example: Annual Performance Report
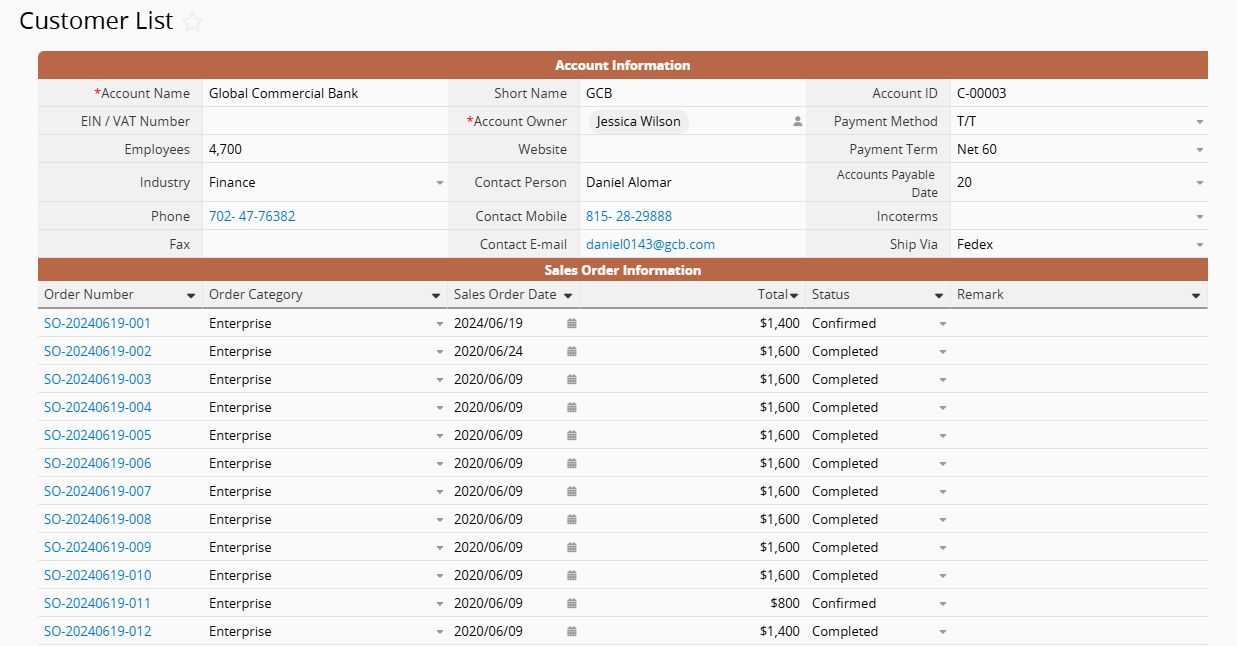
If you need to consolidate data from two sheets, such as displaying past "Sales Order" records in the "Customer List", you can create a Reference Subtable to bring the "Sales Order" records into the "Customer List" based on customers.
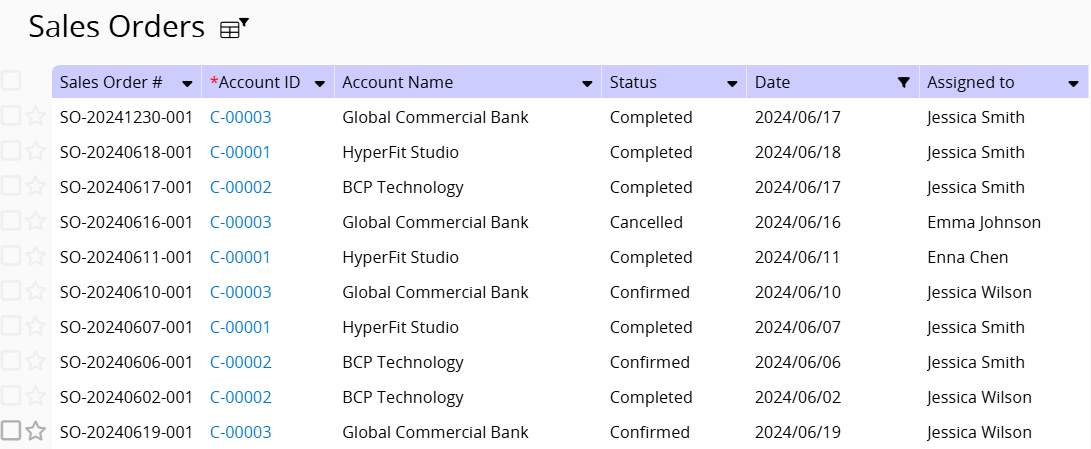
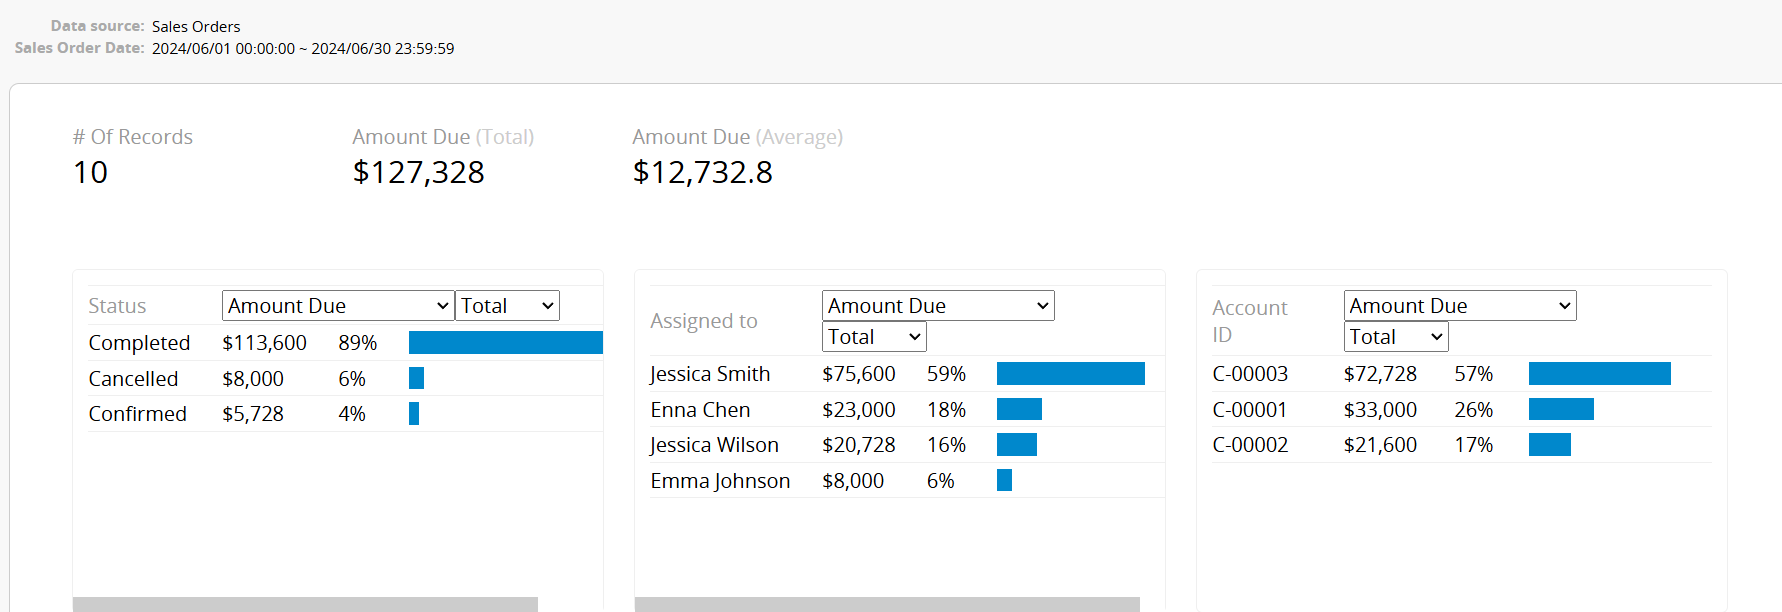
To compile a sales report for the month from the "Sales Order" sheet, you can filter the "Date field". For example, by filtering for June, you will get the sales data for that month.
If you want to calculate the total sales amount, the most intuitive way is to use the Total & Summary features. For more detailed statistics, you can create a Dashboard Report to analyse the total sales, average order value, and more.
If you want to share data with users who are not logged in or export it for further processing, you can export it in formats such as Excel, PDF, and more.
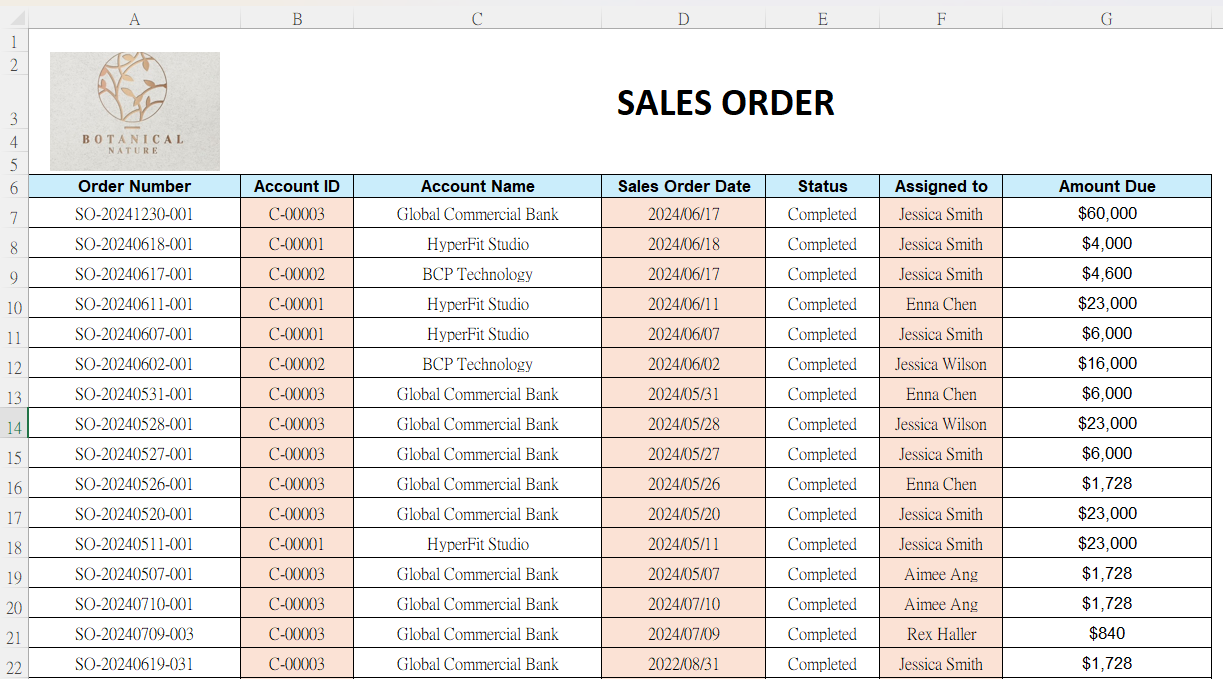
If the company has a specific report format, first filter the data as mentioned in the second point, then use Mail Merge to export it into a custom format, generating a result like this:
If you need to export Subtable data from the Form Page, you can use the Custom Print Report(this feature doesn't support exporting from the Listing Page).
If the desired outcome is not in a spreadsheet or table format, you can use the Reports feature.
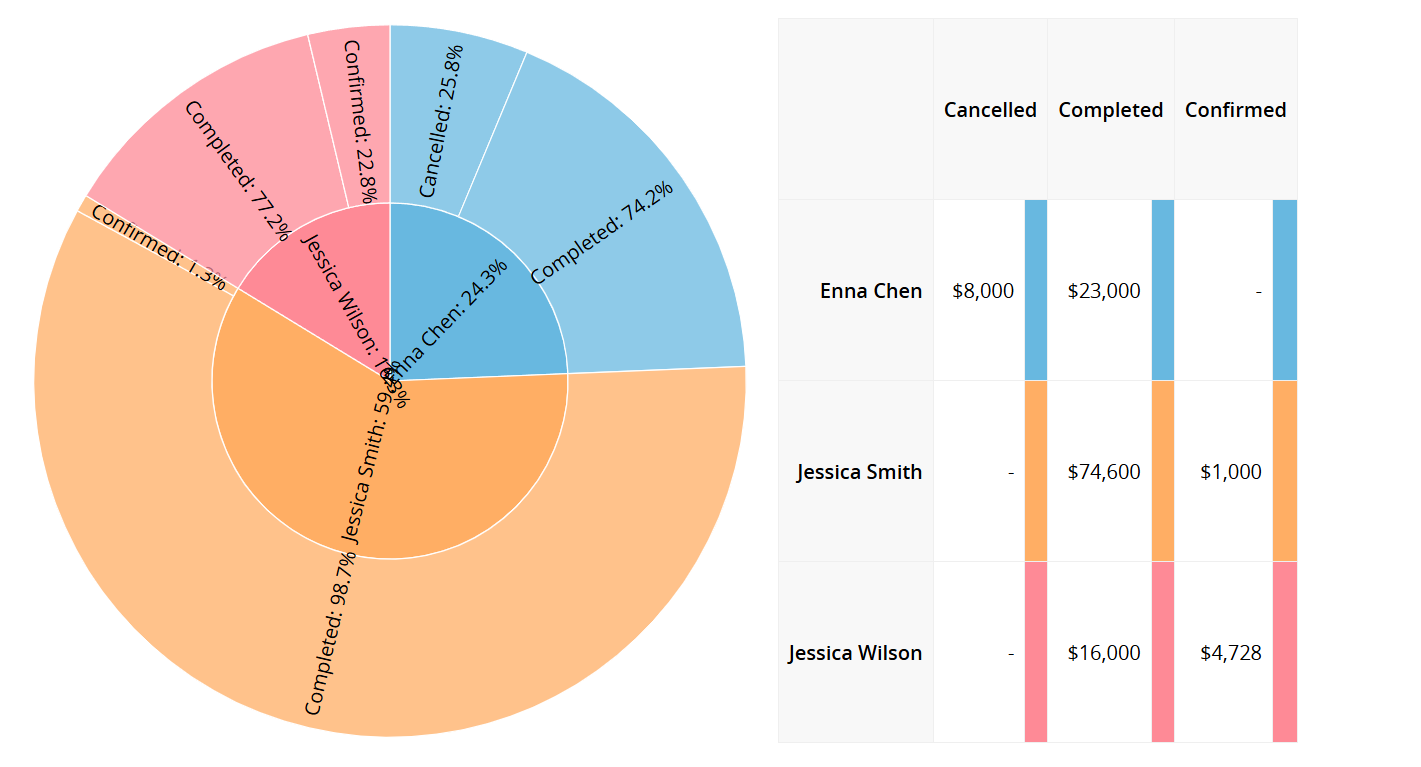
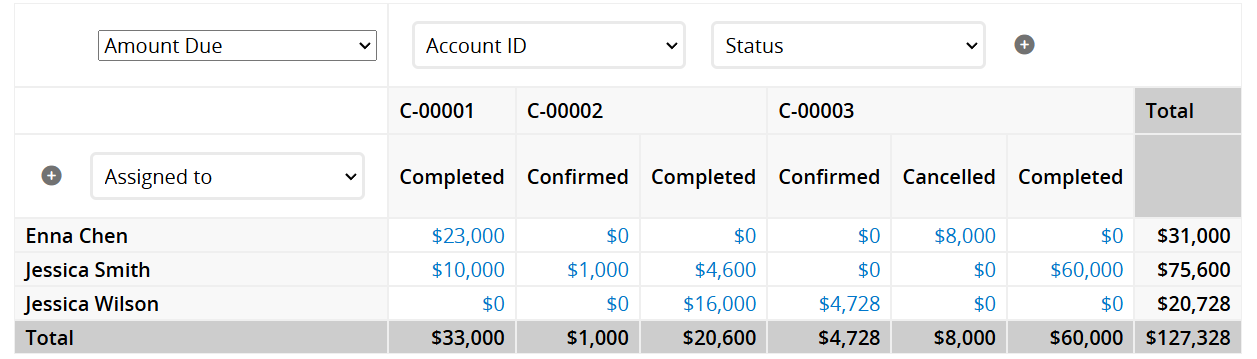
For example, creating a Pie Chart to visualize the sales for the current month by salesperson, or generating a Pivot Table:
 Thank you for your valuable feedback!
